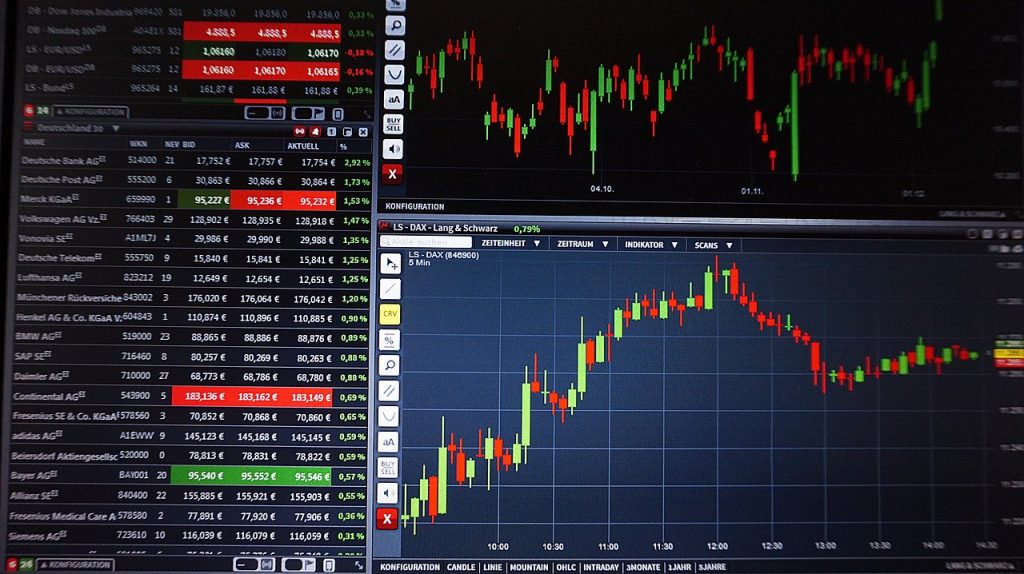
These are trading strategies for beginners as well as more experienced currency traders:
- Day Trading – Entering and exiting a position within the same day.
- Swing Trading – Catching a swing in the market and holding on to that swing until it hits the targeted profit or shows signs of reversal.
- Scalping – Entering and exiting a position frequently, profiting from small price movements.
- Automation – Using software to trade for you, like expert advisors (EA) semi-automatic indicators or scripts.
Day Trading Strategy
Timeframe:
- 1-hour
- 15-minute
Indicators:
- Fibonacci (38.2,61.8)
- ZigZag (12,5,3)
Candlestick:
- Bearish or Bullish Engulfing
Putting it all together:
Step 1: Determine whether the trend is up or down (higher high/higher low or lower high/lower low).
Step 2: Drag the Fibonacci from the low of the zig-zag and the high of zig-zag when the price reverses.
Step3: Wait for the price to pullback to the 38.2 or 61.8 Fibonacci level.
Step4: Wait for a confirmation candle (Bullish/bearish engulfing candle).
Step5: Enter.
Swing Trading Strategy
Timeframe:
- 1-day
Indicator:
- EMA 20
- EMA 50
- EMA 200
Candlestick:
- Bullish/Bearish Engulfing
- Doji + Bullish/Bearish Candle
- Inside Day/Outside Day + Bullish/Bearish Candle
Putting it all together:
Step 1: Determine the overall trend is it up or down.
Step 2: Determine which EMA is the price currently respecting.
Step 3: Wait for the price to pullback to the EMA.
Step 4: Wait for a reversal candlestick to form.
Step 5: Enter.
Scalping Strategy
Timeframe:
- 1-minute
- 5-minute
Indicator:
- EMA 8
- EMA 13
- EMA 21
Candlestick:
- Bullish/Bears Candle
Putting it all together:
Step 1: All 3 EMA are fanned out on 1 direction determines the direction we are going to trade.
Step 2: Wait for the price to pullback to EMA 8 or EMA 13. If price closes above EMA 21 then wait for other opportunities.
Step 3: Wait for a bull or bear candle to form.
Step 5: Enter